
Since the Industrial Age, nearly every piece of commercial equipment invented has had some form of associated telemetry (also known as instrumentation). In most cases this telemetry has been put in place to confirm, modify, and diagnose its operational status. Analog or digital, nearly every device can benefit from instrumentation.
The advent of electrically powered equipment brought the ability to use much more advanced technology to look deeper, in new and exciting ways and extend the range of this telemetry. In addition, the analysis of raw data was no longer limited to a single point in time by a single user, but could be correlated, viewed, and studied by any number of users at any point in time.
Instrumentation has become critical to the operation of any type of complex system. The cockpit of a modern jet airliner houses thousands and thousands of points of data that are being gathered in real time, sourced by a wide array of individual manufacturer’s components in a variety of measurement units. Some key discrete points are presented without interpretation to the crew as they are gathered, while other points may be grouped and considered relative to other discrete points before the crew is made aware of this condition.
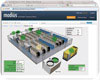
A modern data center is also a complex system. For a data center to be operated efficiently, the operator must gather as much information as possible from a vast array of dissimilar vendor equipment, normalize the measurement units, and then analyze this instrumentation to allow highly confident business intelligence. A modern data center must be designed to take advantage of all of the discrete instrumentation points across IT systems, power chain components, HVAC systems, and building security systems. Aggregating and normalizing these data points (in real time) is critical to achieving previously unattainable efficiency levels.
Historical Approaches
Connectivity has always been the Achilles’ heel of instrumentation plans. Typically, while some level of sensing technology itself has been available in the devices themselves, the ability to transport the resulting data created by these distributed sensors has been difficult. In early mechanical systems, the presentation of many sensors was physically restricted to the sensors’ locations (such as a railroad track switch position mechanical flag), or connectivity was addressed with simple technologies such as pressure transfer lines and round pressure gauges that indicated status at some distance.
Until very recently, modern electrical systems emulated this limitation. Consider a very complex system, the soon-to-be-retired space shuttle orbiter built by Boeing Corporation in the late 1970s and early 1980s. Within its 186 feet of fuselage are more than 1.2 million feet of wire. Each sensor is individually wired to its intended display.
For the same fundamental reason of complexity, over the past 10 years the vast majority of data centers have deployed limited or no instrumentation, and the strategic value of the available metric information has been minimized due to this limited coverage. In nearly all cases, monitoring for IT devices has been limited to LED or LCD indicators on the hardware devices themselves.
In many cases, large portions of critical infrastructure have gone unmonitored.
Sadly, while the management of logical production IT systems has become a huge business today, the real-time management of the critical infrastructure underneath these systems and the interaction of these logical and physical infrastructure management schemes have been left alone.
The State of Instrumentation
Modern data centers need the ability to gather normalized performance data using a combination of in-band and out-of-band instrumentation technologies. (In-band refers to the usage of common general-purpose networking transports such as the existing LAN to carry information, while out-of-band refers to the usage of discrete application-specific transport, most commonly discrete cabling).
It can be argued that since modern data centers comprise many discrete subsystems from a variety of different manufacturers, instruments in the data center must (by design) allow for multiple technologies. The requirement to use multiple sensing technologies stems from three factors: 1) corporate structures that change over time; 2) The fiscal requirement to leverage the almost ubiquitous inclusion of performance instrumentation already provided within many active devices by major suppliers within the data center; and 3) the need to augment all available sources of instrumented data with additional and specific data types such as branch circuit consumption, under floor pressures, or outside temperature.
Device
Active devices today (such as servers and networking equipment) routinely include some form of platform management interface via in-band technologies, most commonly a LAN connection. Once connected, these devices use various protocols built upon the LAN transport to allow access to a wealth of instrumentation data. Some of the most common management protocols include SNMP, WMI, IPMI, and ILO2, and the choice about which protocol to use is commonly made by each manufacturer.
These in-band management interfaces provide a tremendous number of management capabilities, ranging from power cycling a device or reconfiguring its hardware options to the ability to read the various sensors contained within the unit itself. Most commonly, these sensors may allow operational status, temperature and/or power consumption values.
To augment the device-included instrumentation discussed above, two additional types of environmental and power instrumentation have arisen over the past decade, wired and wireless.
Wired Instrumentation
Wired instruments became popular nearly a decade ago when a limited set of additional sense points were desired and the technology for low-power networking was not yet a viable option. Total costs for wired instrumentation (product and services) were fairly steep, and the physical requirements to install such systems were in many cases prohibitive. As such, utilization of wired instrumentation was relegated or limited to only the most critical items or areas within an infrastructure.
The industry has largely left the technology choice for remote management and monitoring up to each individual vendor, although various organizations have put forward proposals for standards to help rectify such widespread diversity. SMASH CLP is a good example of one such standard proposed by the DMTF and currently being considered.
Wireless Instrumentation
The first mature wireless technology was based upon PARC’s years-earlier “Smart Matter” research work which provided the basis for a new DARPA funded project called Smartdust. Smartdust and related projects were ultimately conducted within several of the University of California (UC) campuses (Berkeley, Davis, and others) to study low power, miniaturized instrumentation.
All of the subsequent commercial environmental instrumentation offerings based upon this UC research work can be described or approximated by the current standards outlined within the “Zigbee” (or officially known as 802.15.4-2003) specification. The created products each offer very low power consumption, high data reliability and due to their limited distance capability, the ability to send its data upstream via a “hop” to its closest neighbor thereby creating a segmented upstream path.
While successful in realizing the dream to transport instrumentation metric data wirelessly in a small form-factor, all of these UC-inspired low-power product offerings available today tend to be susceptible to severe distance limitations due to interference with the structures they are deployed within and signal type itself. As such, these systems must typically deploy a larger number of instrumented sensor and receiver combinations, each with smaller ranges, and they themselves intercommunicate to create a mesh topology to hop from receiver to receiver before getting data delivered to the intended point of data collection.
More recently, a second mature wireless technology to make its appearance in support of data center instrumentation was a novel usage of a mature technology called RFID. In the mid 1990s, general-purpose UHF RFID products were finally introduced to the masses due to a wealth of applications stemming in the retail inventory management space.
Recently, inexpensive commercial-grade RFID solutions have been introduced which have the required level of performance and distance to satisfy the commercial IT segment. These new RFIC-based products have been introduced using an “active” version of RFID running at a very building-friendly 433 MHz frequency. The active version of RFID takes the original technology one step farther by allowing each individual sense point to periodically report its metric data without the need to manually interrogate the unit for information. This combination of battery-powered RFID and the frequency choice of 433 MHz provides for years of self-contained battery life across an impressive distance, regardless of the data center construction materials, rack configurations, and enclosure steel specifications.
The choice for instrumentation within an IT structure is really not about choosing one specific technology that seems to be best suited for any given company. Strategically, it’s about which combinations of solution(s) that when put together, form a complete view of actionable management information.
The full range of instrumentation data sources to be considered will ultimately include many of the following technologies ion wide-scale usage today:
1. IT Appliances, the “1U” or “2U” device. Most modern IT equipment has some form of instrumentation built-in. Each of these appliances uses various forms of communications protocols to present this hardware-based instrumentation. For networking devices, it is very simple and SNMP has arisen as the de facto standard to communicate nearly all aspects of a given platform in operation. For server devices, most IT vendors have focused on using IPMI or a flavor of it.
2. High-Density Chassis. The largest IT providers (such as Cisco, HP, Dell, and IBM) have created complex chassis based offerings over the years to combine IT functions. These chassis include high-density blade servers, storage fabrics, and network switching devices. Each of these chassis has a combination of function cards, management cards, power cards, and cooling trays.
3. Discrete Individual Networked Sensors. A very traditional approach to monitoring a few environmental points has created the market for single-purpose, wired instrumentation products. Companies such as Axis and IT Watchdogs create fairly low-cost small form-factor sensors that most typically have a single LAN port and an external power supply. Since they do not maintain connectivity to any larger system, they typically provide the current values for the sensor itself.
4. Wired Instrumentation Systems. Building upon the discrete concept of instrumentation, a number of vendors have gone to the next level and built ‘platform’ systems based upon the concept of aggregating many discrete wired instrumentation products. Vendors such as Sensaphone, Avtech, Netbotz, and Network Technologies have created fairly complete catalogs of sensor devices and aggregation hubs that can be connected to any given LAN and provide the current and historical values of any of the sensor points deployed within their own system.
5. Wireless Sensor Systems. The wireless category of instrumentation originated with the early commercialization of the 802.15.4 or Zigbee standard, and has been applied as a transport by sensor monitoring companies such as Synapsense, ArchRock, Dust Networks, and PacketPower. These wireless providers offer a growing lists of instrumentation sensors and can all be thought of as low-power, short-distance hot spot technology.
6. Wireless Sensor Systems (Active-RFID). Perhaps one of the newest categories of instrumentation is based upon the RFID technology and commonly referred to as Active RFID. The technology has been introduced by a company named RFcode. Products developed using Active-RFID exploit the lower frequency, building-friendly 433-Mhz frequency-range, which provides for highly reliable, long distance communications in a crowded data center.
7. Building Management Systems. Historically, nearly all environmental information was instrumented, gathered and presented by the chosen BMS. The chosen BMS did a adequate job at gather the more traditional HVAC-style componentry, but did very little outside of their realm.
Normalizing Data
All instrumentation uses any one of a number of general-purpose transport layers and some type of vendor chosen protocol to communicate and present its values to the user, and each device type does so differently. The use of a common network protocol like SNMP still leaves a great deal of vendor-specific representation uniquely defined, making it fairly difficult to interpret these values when interacting with this device.
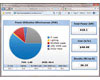
All this instrumentation diversity creates the absolute requirement to understand what specific vendor-provided data is being retrieved and then to normalize all of this data into some agreed common unit of measure. This ultimately allows the analysis of data for business intelligence and can provide the consolidated visibility into the data center.
Conclusion
A well-conceived IT instrumentation plan calls for the ability in a single monitoring structure to allow for all these aforementioned instrumentation technologies. For a wide range of technical and organizational reasons, most companies will find themselves having to gain access to various combinations of these instrumentation technologies in order to gain a comprehensive picture of their complete infrastructure.
Second, all data collected will be required to be normalized.
Last, once instrumentation data has been made accessible, and has been normalized, it is critical that these data can be aggregated over vast geographies as most corporations find themselves with more than a single location. Large and small, all companies deal with multiple sites, and various quantities of IT infrastructure at each location.
A simple set of steps can be executed to begin taking advantage of this previously untapped source of knowledge:
1. Take inventory of the IT structures contained within. It is important to include devices that have instrumentation already contained within but are left unconnected today.
2. Identify key subsystems that would affect business practices or corporate production. Consider core IT devices as well as the underlying power distribution components and associated cooling structures.
3. Consider the most relevant key performance indicators relevant to running core IT operations efficiently and set as a near-term higher priority goal the creation and visibility of these KPI metrics in a real-time. Look for ways to leverage this analysis.
4. Determine the instrumentation systems that are currently available as well as where additional system(s) will be required to fill in critical gaps. Create a strategic plan that identifies the risks associated with NOT monitoring and actively managing each component, and look for the best instrumentation solution(s) for each major area.
5. Look for an overall higher level vendor-neutral monitoring solution that is not tied to any single hardware instrumentation platform, and can be rapidly deployed. This system should be able to gather in real-time metric and key performance information from any type of instrumentation. Deploy sooner rather than later.


