In a simpler time, the energy and environmental costs of running an information and communication technology (ICT) facility were not the main concern of the info-center manager: They paled in comparison to maintaining the performance levels promised in service level agreements (SLA).
Recently, solutions for “greening” the data center have become a priority for C-level executives and IT managers alike, due to soaring energy costs, increased pressure from environmentalists, and costly new proposed federal legislation. Suddenly facility operators have to pursue a holistic approach, i.e., maximizing business metrics for service performance and availability, while minimizing the environmental (energy consumption and carbon footprint) costs of operating their ICT facility.
Holistic Energy Management and Metrics
Unfortunately, most facilities don’t come with an easy-to-read owner's manual to guide operators through the process of balancing energy usage and reliability. A misfiring spark plug in a car is annoying and wastes gasoline, but inefficiencies in a data center could cost a company hundreds of thousands of dollars per month in energy charges, not to mention jeopardizing reliability.

To prevent operators from “flying blind,” The Green Grid, The Uptime Institute, and McKinsey & Co have proposed frameworks with accompanying quantifying metrics for identifying opportunities for improving energy efficiency, and for providing top management with strategic guidelines on minimizing the impact of energy costs on their businesses.
Their frameworks present usable models of data center energy consumption upon which to base strategic planning, specific examples of how best practices can reduce a data center’s energy consumption, and a set of metrics that can be applied in order to plan and manage energy use in the data center.
Measuring Energy Efficiency
About five years ago, the need to define (and measure) energy efficiency was recognized as it became apparent that the increasing amount of energy necessary to power and cool the engines of facilities was not just a technical, operational nuisance but a potential threat to business profitability. The energy consumption of ICT was increasing at a prodigious rate due to a geometric rise in computer equipment performance [factor of three every two years] without an accompanying increase in effective energy efficiency [doubling every two years].
Energy efficiency metrics are mathematical representations of a dictionary definition of efficiency. Efficiency is “the ratio of the useful energy delivered by a dynamic system to the energy supplied to it.” In the case of a data center, the easiest energy flow to measure between the systems is electricity.
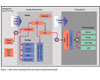
Figure 1 shows the electricity flow between the power, cooling, and computer systems of a typical data center and the basic points of power measurement. Total data center energy consumption is measured at Point A, the utility meter. Point B is downstream from the power distribution units at the input to the IT equipment load. Power at Point, C taken downstream from the equipment power supplies, is typically direct current, which represents the computer load.
Power Analytics Applied
The Green Grid states that continuous real-time monitoring should be employed to do the historical trending and statistical analysis to gain real insight and to successfully manage an IT facility’s energy efficiency; this is especially important to understand in light of the dynamic nature of an ICT facility. “The initial design of the data center is obsolete the day after the installation and commissioning is complete. Often, energy efficiency calculations are based on a static design instead of the dynamic data center configuration. The designed (static) versus actual (dynamic) nature of a data center must be considered. Improvements will come through incremental step changes in infrastructure over time. Also, it is important to keep in mind that as the load changes in the data center, the operating point of the subcomponents on their efficiency curves will change.”
Recently, a software technology platform called power analytics has made it possible to have true insight into the operational variations between the designed versus actual nature of a data center. Power analytics solves the problem of mission-critical facility “brain drain.” Like other fields of analytics, such as business analytics, predictive analytics, etc., power analytics is the science of scrutinizing electrical power infrastructure to determine if it is performing properly, energy efficiently, and in a manner that ensures no operational problems are on the horizon, by accurately interpreting the conditions that could allow those issues to emerge.
This critical tool diagnoses the power infrastructure at millisecond speeds, giving facility operators the ability to manage their sites with the same level of expertise as the designer who engineered it. Power analytics is driven by sophisticated mathematical modeling and synthesizes the performance specifications of all the electrical interconnections and equipment of the electrical design model (CAD model) into a digital image of the actual facility. The power and uniqueness of the platform is derived from this complete encoding of the design specifications from the original, as-built power infrastructure into the model design base.
During a data center’s normal operation, power analytics dynamically and continuously compares the encoded model design base of the facility with the operating parameters and interoperability of each piece of hardware, from the main switch gear, through the facility’s power and cooling infrastructure, to the critical computer load (see figure 2). Power analytics can accurately corroborate the operating parameters of a “live” component with their as-designed, or other model specifications.
It is not unlike automobile’s engine management system (EMS): by knowing the precise operating parameters of each component in a vehicle, and measuring each component’s readings individually and systemically, the EMS is able to fine-tune engine performance for maximum power and fuel efficiency.
A successful energy management program is built upon having accurate information regarding the consumption of energy: where and when it is consumed and the operational and environmental costs. Power analytics can report accurate, real-time energy usage based on the amount of equipment in racks, the capacity and redundancy of the power distribution and cooling equipment infrastructure, and the variations in computer loading. Moreover, these data can be compared to the as-designed energy usage calculated by the analytic system to give insight into system instability, unbalances, capacity restraints, or overloads.
Is this capability essential for an effective energy efficiency program? Simply determining data center infrastructure efficiency (DCiE) weekly or monthly will provide the data to show the effectiveness of measures to improve efficiency. However, what if server consolidation/virtualization, changes to the cooling and power infrastructure, or other energy efficiency measures result in the instability of the data center?

By increasing the granularity of the energy measurements, a hierarchy of subsystem power losses can be revealed. Correlated with the efficiency metrics, a ranking of a contributor’s power loss by magnitude can guide changes to lower the energy consumption of the subsystems. How can this be done and still support the requirements of the IT equipment, and meet service availability?
- Can the energy efficiency status of a multi-use facility be determined accurately?
- How can the environmental benefit and energy cost impact of efficiency metrics be determined?
- Can new IT system designs, network architecture, and equipment options, developed to enhance the availability, reliability, and productivity of information factories, be selected and justified to improve business performance goals while using less energy?
- How can the productivity and utilization of IT assets be maximized?
The power analytics platform is the ideal architecture for energy management in the critical space because it does so without compromising the primary mission of availability management while addressing the important costs issues such as:
- What is the actual cost for energy for the critical space based on my billing structure?
- How does that cost fluctuate on an hourly, daily, monthly or annual basis?
- How is energy cost impacted by SLA agreements?
- How will changes we are planning affect energy cost and availability?
Energy Management and Simulation
Fans of the television series “Star Trek: The Next Generation” will remember an ingenious new invention created for the series called the “Holodeck.” The Holodeck was a highly realistic virtual staging area, in which any type of environment could be simulated and experienced first-hand for training and recreational purposes. It had both predictive (“What if”) and forensic (“What Did”) capabilities, that allowed crew members to fully test a proposed course of action or perform an “autopsy” to understand how a certain problem or anomaly occurred.
Power analytics systems provide precisely these types of benefits for facility operators. Their real-time simulation capabilities make for a powerful tool for the testing of configurations, maintenance, repair, and other procedures before attempting them on live systems. Simulation functions by capturing a “snapshot” of the current facility’s input power parameter settings. By altering selected model specifications, e.g., circuit breaker settings, the impact of real-time, “what if” system changes (server loading, power distribution and cooling, capacity shifts, equipment substitution, etc.) can be projected and analyzed. The facility’s current performance and costs, i.e., “what is,” can be compared to performance and costs based on “what if.”
Virtualization, server consolidation, decommissioning, improved airflow and cooling efficiency, efficient power distribution, rationalized capacity, and other energy management measures involve the risk of unintended consequences. The simulation of a system’s performance in a virtual environment can safely investigate the effects of changes that might have an impact on the live system without the risk of actually doing live testing. Moreover, during the “what if” simulation of an energy reduction scheme, the data center’s performance can be watched to make sure the IT equipment is supported, and system availability and reliability are maintained.
Energy-efficiency metrics are valuable in revealing the efficacy and ranking of measures taken to reduce energy use. How can cost benefits be estimated? If real-time utility costs (energy and power demand rates) are recorded while power analytics technology scrutinizes the data center performance, costs at a measured performance state can be assessed. The utility costs verified by local rate table calculation can be correlated with “what if” performance simulations (see figure 3).
Conclusion
If simulations are run with equipment costs correlated and power measurements taken at the individual equipment level, then the cost impact of energy efficiency measures can be determined. Armed with the power of simulation and power analytics, the energy efficiency of new facility system designs can be explored, equipment delivering the most efficient performance can be selected and cost justified, and as productivity metrics are refined, the total cost of operating the data center can be understood and verified.
The added complexity of energy management will increasingly drive system and financial decisions. Power analytics uniquely addresses the continuum of energy management, from availability and performance to reliability and quality-a timely and powerful solution for the 21st Century technological enterprise.


